



 Teams
 SharePoint
 Slack
 QR Codes
 PDF
 Active Directory
 Workday
 ADP
 Canva
See the whole picture behind every message
internal communication analytics
You put real care into every communication, so you deserve to know what happened after you hit send! See who it reached, what worked, and what to do next, with everything you need to share with leadership and prove your ROI.
How you’ll know what’s working through Workshop
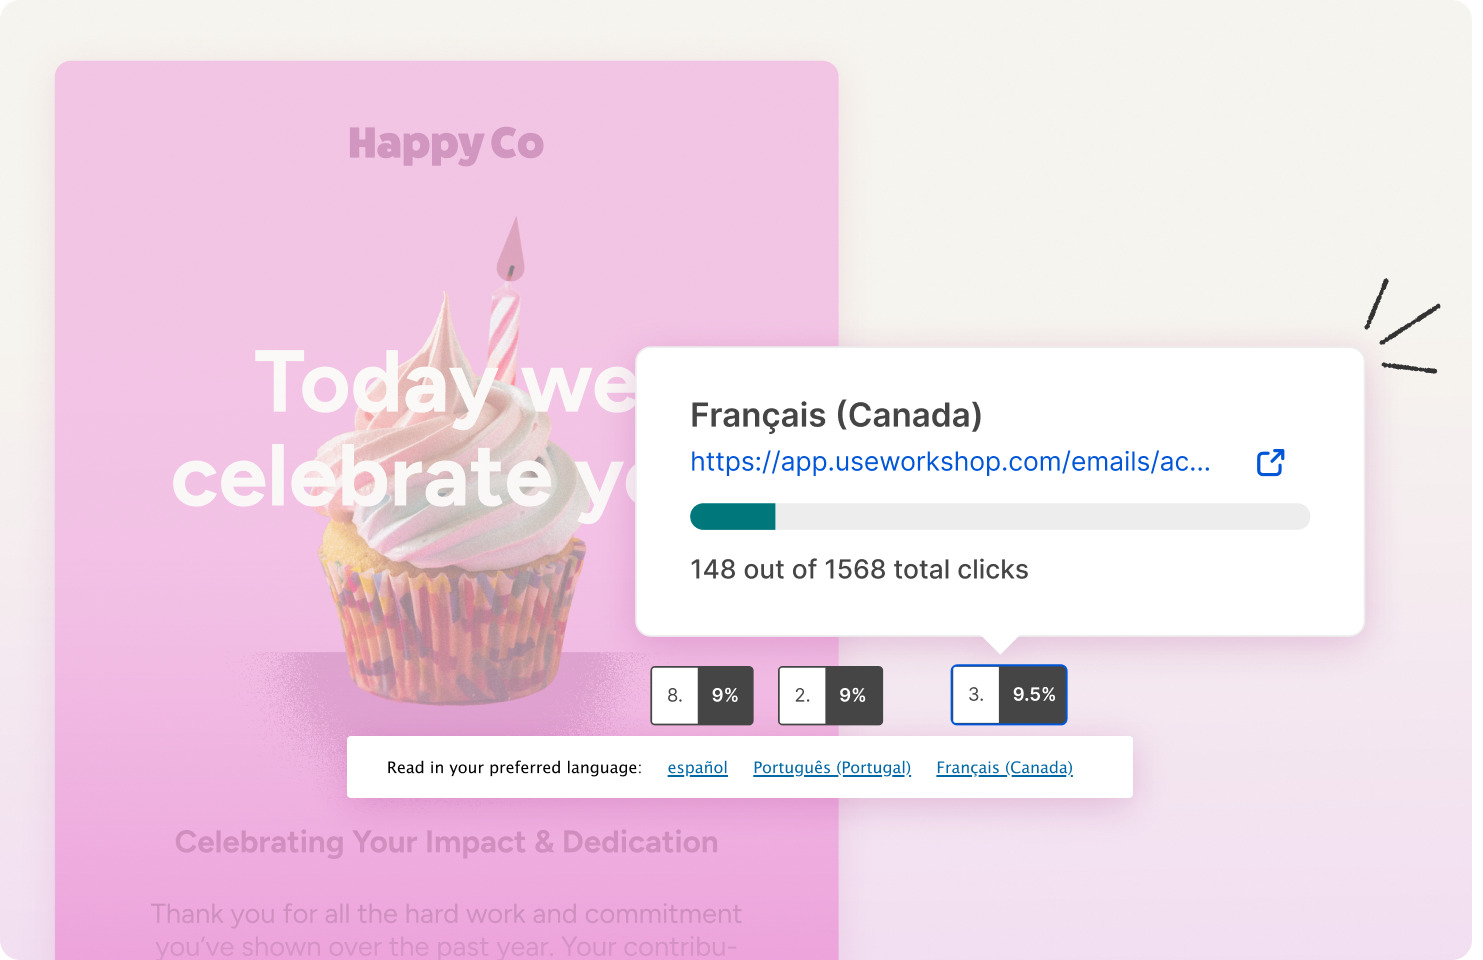
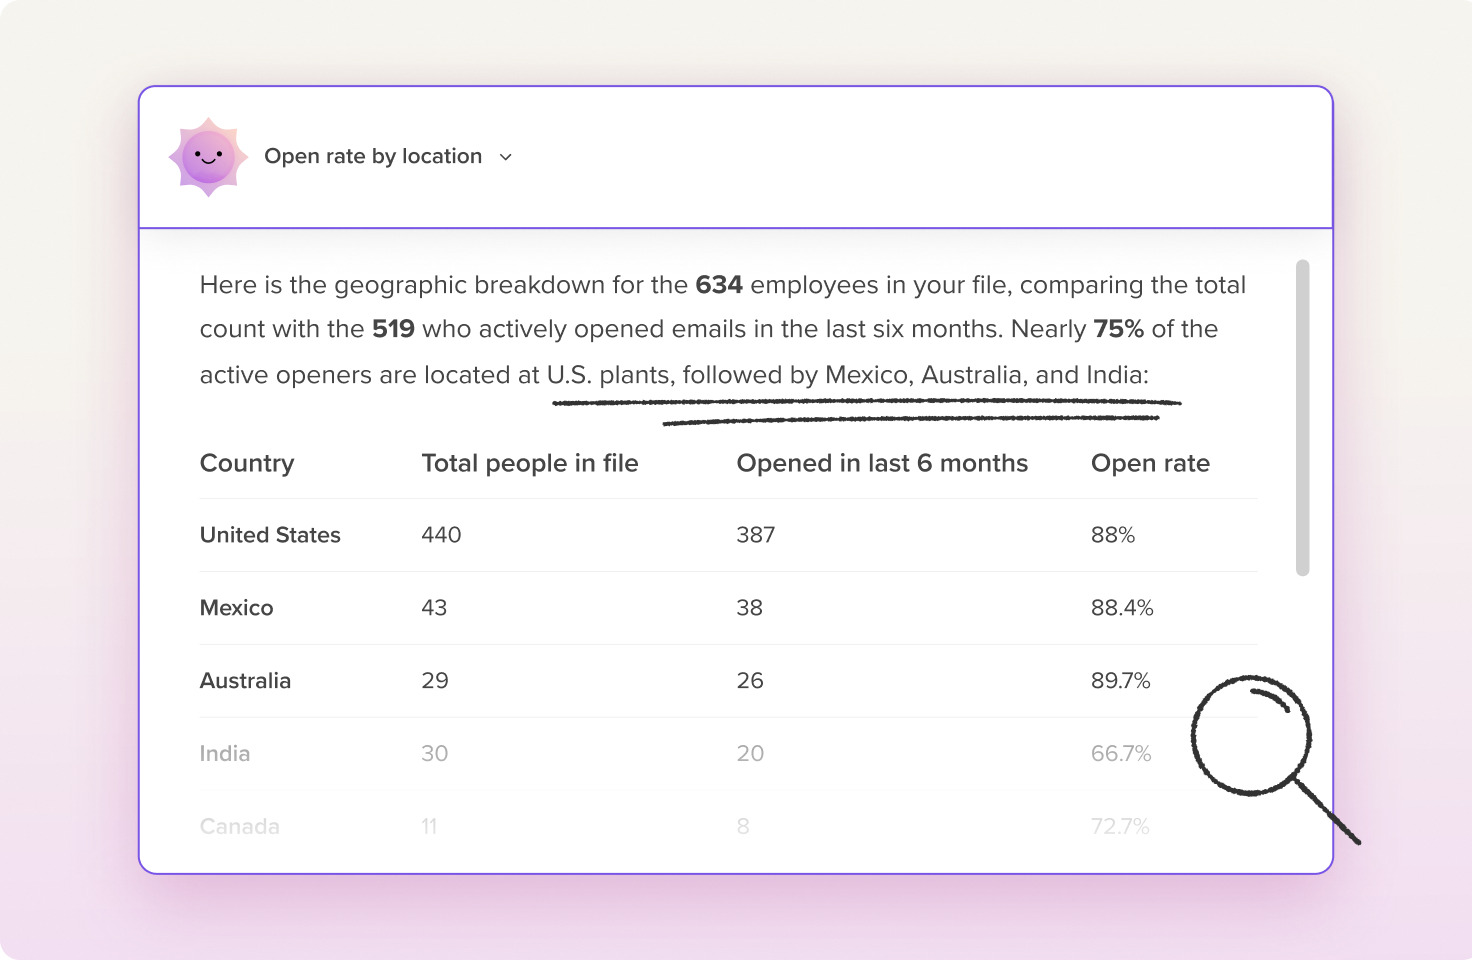
From guessing your numbers to knowing
| Before Workshop | After Workshop |
|---|---|
|
Wondering who read through the email |
Know exactly who read it |
|
Wondering if your open rate is actually any good |
Know what great looks like |
|
Manually building reports in Excel |
Answers in minutes, not hours |
|
Hoping people actually read it after you hit Send |
Readership you can grow |

Custom reports, your way, in seconds
custom reporting
Every leadership team wants something a little different – and we get that. Choose metrics that matter, compare campaigns and teams you care about, and share a clean, exec-ready view without rebuilding anything in a spreadsheet.
Data that does the work for you
Workshop knows your comms data through and through. It will get you actionable steps like how to increase that click-through rate, swapping links with high-contrast buttons, and testing out different send times to increase your open rate.
Curious? Try a question:

Customer Support led last quarter with a 91.2% open rate, and Finance drove the most action with a 15.9% click-through rate. Facilities was the least engaged, with a 68.9% open rate and just 12 link clicks all quarter.
Next step: Add a content block shown only to Facilities in your next company-wide update, and see if more tailored information lifts their engagement.
Customer Support led last quarter with a 91.2% open rate, and Finance drove the most action with a 15.9% click-through rate. Facilities was the least engaged, with a 68.9% open rate and just 12 link clicks all quarter.
Next step: Add a content block shown only to Facilities in your next company-wide update, and see if more tailored information lifts their engagement.
“Open Enrollment Is Live” led the quarter with a 29.4% click-through rate, and your CEO’s Q3 update reached the most people, with 410 unique opens. Your New Hire Journey emails hit 100% open rates.
Next step: Lead with what directly affects employees, like deadlines, benefits and leadership direction. People engage most when the message is about them.
Your Company Newsletter’s click-through rate more than doubled, from 5.4% in Q3 to 12.4% so far in Q4. The difference is that both Q4 issues included polls and RSVP buttons, while most Q3 issues were text-only. Q4 open rates should keep climbing, since the latest issue went out yesterday.
Next step: Keep at least one interactive element, like a poll or RSVP button, in every issue.
“Annual Engagement Survey Is Open” was your best email, with a 35.9% click-through rate. “New PTO Policy” reached the most people, with 421 unique opens. “Q4 OKR Kickoff” had a healthy 77.7% open rate but the lowest click-through rate, at 4.5%.
Next step: Give updates like the OKR kickoff one clear action, such as a button to view team goals, so readers have a reason to click.



Analytics in action
Turn your numbers into your next move
-
Prove your impact
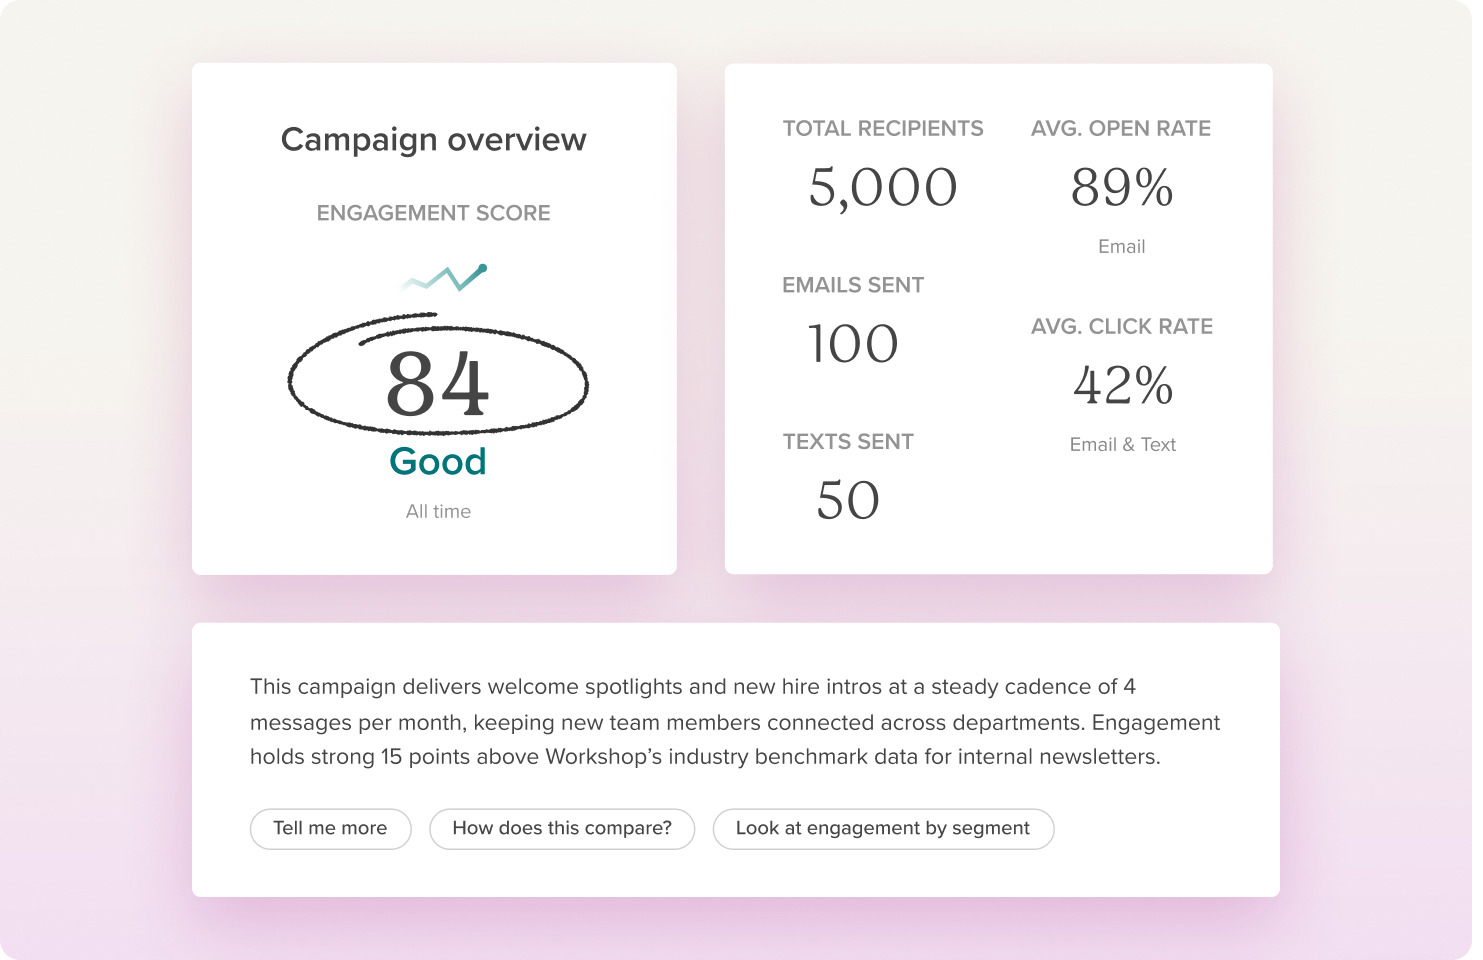
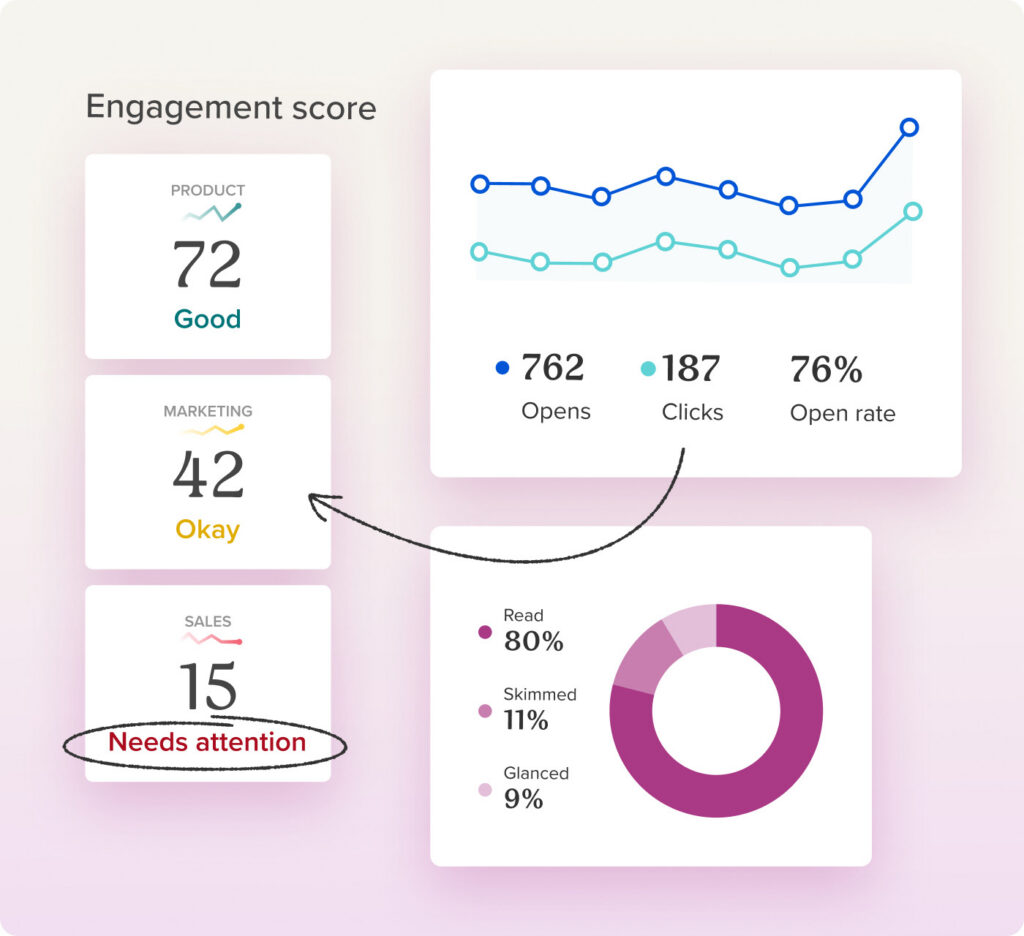
Walk into leadership meetings with numbers you can stand behind. Compare campaigns quarter over quarter, see how you stack up against the 2026 benchmarks, and share a summary your execs will actually read.
-
Find who’s engaged
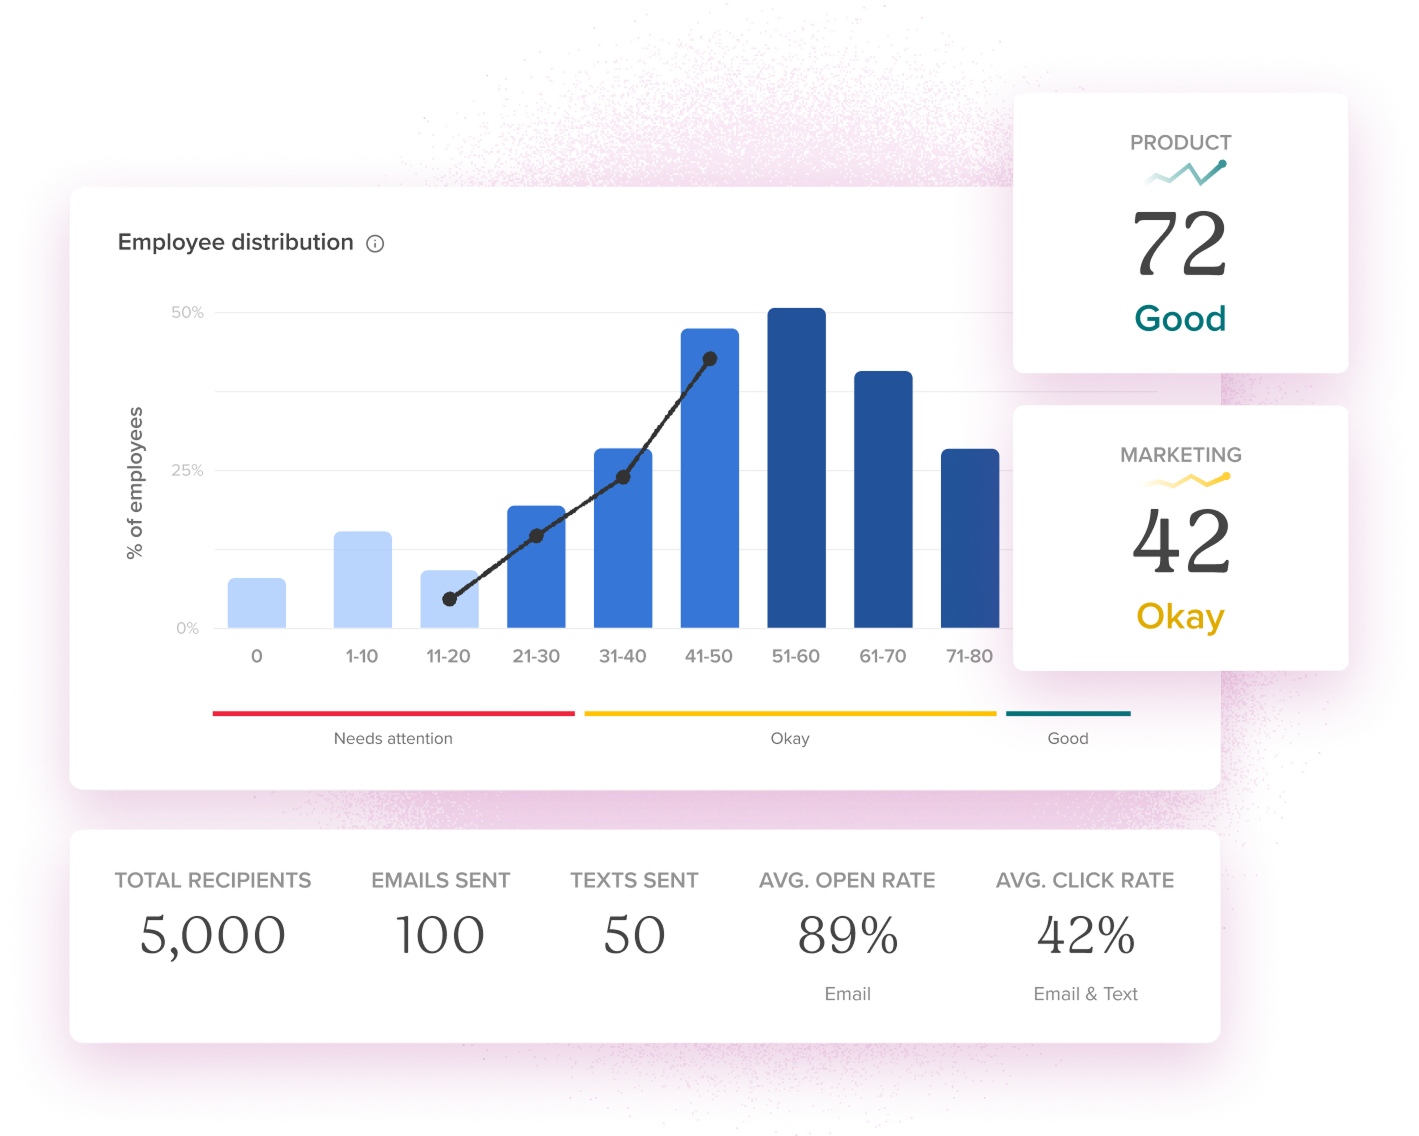
See your most and least engaged departments and locations at a glance, then follow up by email or text before an important message gets missed.
-
See what resonates
Find your best and worst emails and the links people actually click. Then shape next month’s newsletter around what your people care about most.


Not sure where to start? Start here!
-
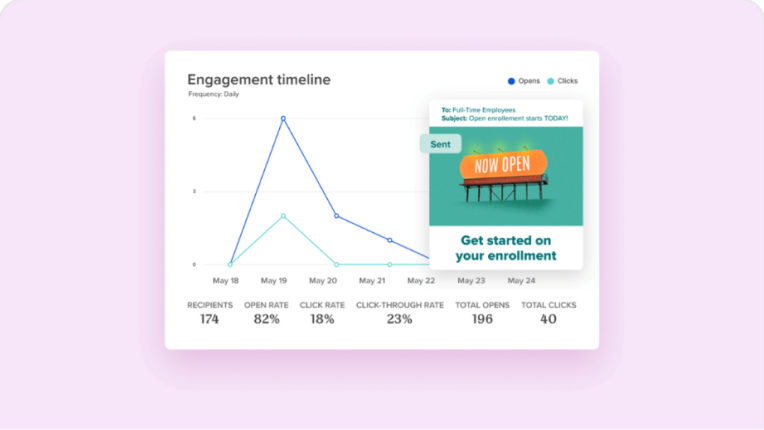
The best internal communications metrics to track
-
2026 internal comms benchmarks: a live discussion
-
Internal Communication Trends Report 2026
Ready to see the impact you’re making?
You’ve been doing meaningful work all along. Let’s make it visible!
FAQs
From your very first send, you’ll see who opened, who clicked, and how long they spent reading, for every person, team, device type, and more! No more guessing whether the big announcement landed.
Plenty! Clicks on every link, a click map of where attention goes, whether people read, skimmed, or glanced, and how engagement changes over time. Together, they tell you what people actually care about.
Yes. See exactly who hasn’t opened yet, then send a quick follow-up to just those people. With automated Journeys, reminders stop as soon as someone opens.
Yes! Filter results by the fields you already keep in your HR system, like department, region, job level, or tenure. Compare one office to another, or see how frontline teams engage compared with headquarters.
Yes, and we give you two views so you can read them the way you need to. Total opens show every open, and unique opens to show your real reach. During onboarding, we’ll also help your IT team safelist Workshop so security devices don’t skew your analytics.
You stay in control. AI training on your data can be turned off, and so can AI features if your security team prefers.
Your data is hosted in the US, or in the EU (Frankfurt) if you need it there. For GDPR, we sign a DPA, and you can turn on privacy settings that anonymize individual data.
Turn on anonymized reporting and use role-based access to decide who sees what. You’ll still see how every message and campaign performs overall.
Share a clear summary of how a message or campaign performed, compare it with past sends and the 2026 benchmarks, and export it as a PDF for your next leadership meeting.
Across Workshop customers, the average internal email gets a 73% open rate and a 11% click rate. Our 2026 Benchmarks Report breaks it down further, so you can see how you compare.
Yes. Group related emails, texts, and pages into a campaign, then compare them week over week or quarter over quarter to see what’s improving.
Yes. Export any report as a CSV or PDF. To pull data into Power BI, Tableau, or your own dashboards, add the Analytics API (a Premium add-on).
Yes. Every plan includes per-recipient data, with no special send mode required.
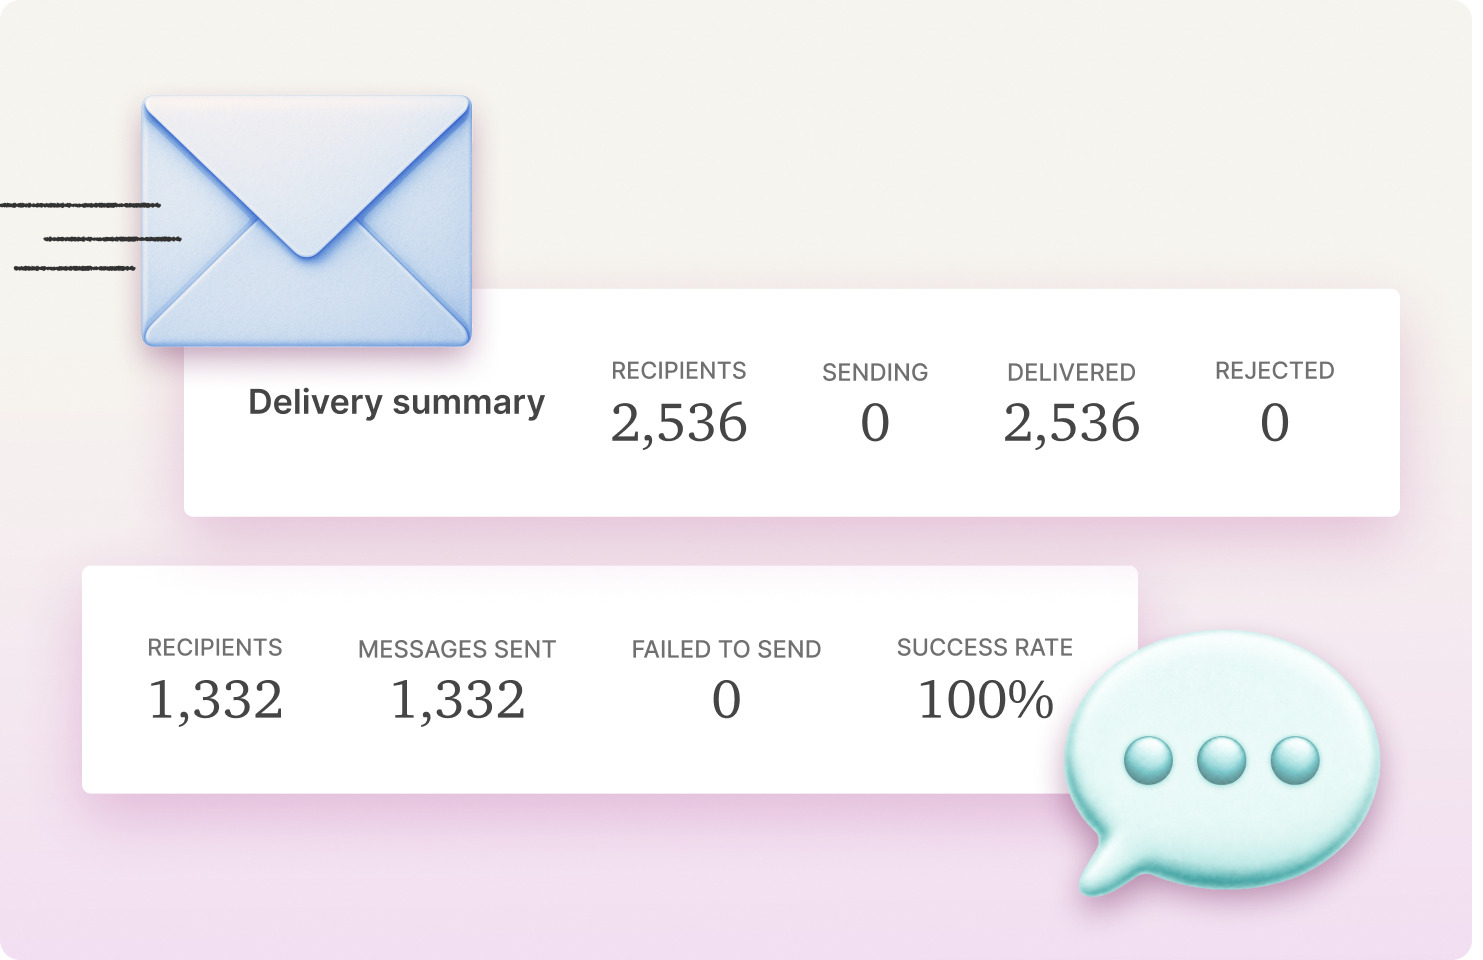
Yes. You’ll see delivery, clicks, opt-outs and replies for every text, right next to your email results in the same campaign.
We track everything you send through Workshop: email, text, and Pages. When you cross-post to Slack or Teams, you’ll see the visits that come back to your content, but we can’t see reading activity inside those tools.
Not at all! With natural language queries, you just ask a question the way you’d ask a teammate, like “Which departments were least engaged this month?” or “How did this quarter’s newsletter compare to last quarter’s?”, and get a clear answer in seconds. Cici, Workshop’s AI agent, reads your comms data for you, so there are no spreadsheets to build and no data degree required. 🙂


