

 Teams
Teams SharePoint
 Slack
Slack QR Codes
 PDF
PDF Active Directory
 Workday
 ADP
ADP Canva
CanvaInternal Communication | Metrics
2026 internal comms benchmarks: what 186 million emails taught us


186 million emails, 580 companies across 13 industries, and 1 brand spankin’ new Internal Communication Benchmarks & Best Practices Report!
This year’s report is packed with data that can help you make smarter decisions, prove your impact to leadership, and build a strategy your employees will actually engage with. Here’s a deep dive into what we found and (more importantly) what you can do with it!
How do your internal comms stack up?
Download our 2026 Internal Communication Benchmarks & Best Practices Report to find out!
Download the report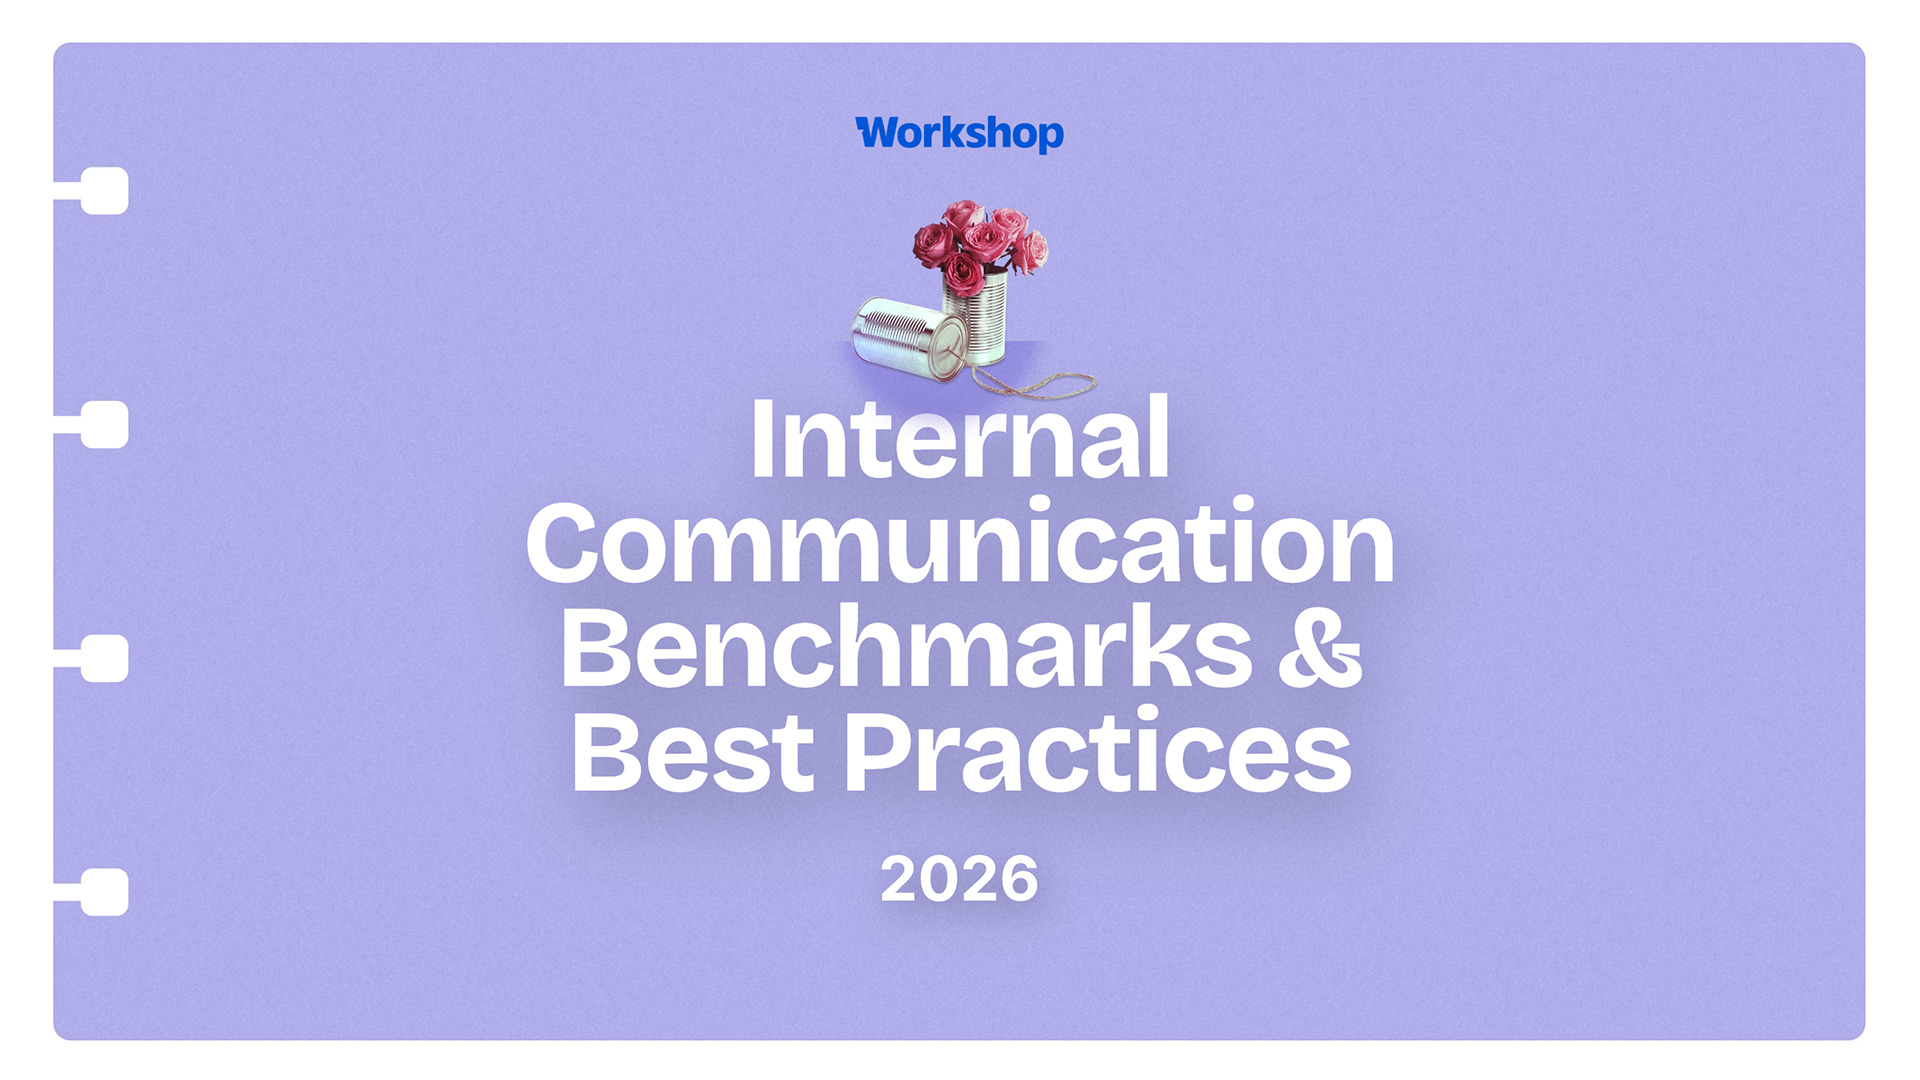
Key takeaways from our 2026 benchmarks report
-
- The new benchmark is 73% median open rate, but your own baseline matters most.
- Send 4–6 emails per week for the best balance of open rate and CTR.
- Smaller, targeted lists outperform mass blasts (73% vs. 58% open rate).
- Add personalization! It’s a low-effort, high-impact tactic that fewer than 1 in 8 emails currently uses.
- Text-heavy emails drive more clicks when action is the goal; designed emails build culture.
- Monday at 9 AM is your best send window for open rates.
- Subject lines at 21–40 characters perform best. Keep them clear, specific, and action-oriented.
- Keep most emails between 201–500 words and test longer formats intentionally.
- SMS gets 29% click rates… it’s probably your most underutilized engagement channel.
- Journeys have an 83% open rate! There are plenty of use cases that you can apply to your comms workflow today.
- 75% of teams used AI in 2025 — and with the launch of Cici (our AI assistant) in early 2026, that number is growing rapidly!
- Benchmark by department and segment, not just company-wide averages.
Prefer to watch? Devin and Olivia covered all of this live — catch the full discussion below.
Internal email benchmarks
Before we get into the internal email numbers: benchmarks are just a starting point. If your open rate is 60% and the industry median is 73%, that doesn’t mean you’re failing! Benchmarks open up opportunities to improve, and we’ll outline some specific things you can implement into your strategy to do so! Seeing industry data is helpful, but the most valuable benchmark you’ll ever have is your own baseline from last month, last quarter, last year, etc. Let’s dive in!
The new open rate benchmark
The headline stat for 2026 is a 73% median open rate across all industries, compared to an average of 76% in 2025.
When we were combing through the data this year, we decided to switch from average open rate to median open rate – and that’s intentional!
Internal comms teams vary wildly in size, industry, and structure. A 10,000-person enterprise has a completely different inbox dynamic than a 200-person startup. Using the median gives you a truer “middle of the pack” number to benchmark against, rather than one pulled in either direction by outliers.
The top quartile across Workshop customers (by the way) sits at 83% — so there’s a real ceiling to chase if you’re motivated!
Alongside open rate, here’s where the overall benchmarks landed:
- Average click rate: 11%
- Average click-through rate (CTR): 15%
- Read time: 77% of emails were actually read (8+ seconds), with 15% glanced and 8% skimmed
That last number is worth sitting with: 77% of people who opened emails actually read them! That’s a telltale sign that internal email isn’t dead… and when it’s done right, employees are genuinely paying attention.
How often should I send?
One of the most actionable findings in this year’s data: companies sending 4–6 emails per week achieved the highest open rate (66%) and CTR (12%).
Above 10 sends per week, CTR drops sharply to 7%, so don’t flood your employees’ inboxes! They may still be opening, but they’ve probably stopped clicking. If you’re currently blasting employees daily or more, consider pulling back and making each send count. Quality over quantity and all that jazz.
Size your lists intentionally
Here’s a finding that might change how you think about your distribution strategy: emails sent to fewer than 500 people achieve a 73% open rate. Emails sent to 5,000+ recipients average just 58%.
The reason is simple… When an email feels like it was written for you, you’re more likely to open it. When it feels like a mass announcement, it’s easier to ignore.
So, ask yourself before every send: does this actually need to go to everyone? Even light segmentation (by department, location, or role) can dramatically lift engagement.
Personalization is underused
Emails using personalization and merge tags (like {first name}) average a 71% open rate vs. 68% without — a consistent 3-point lift! That might not sound dramatic, but at scale, it adds up.
Aaand, personalization is a HUGE opportunity for internal communicators in 2026. Fewer than 1 in 8 emails sent in 2025 used personalization. In the UK, only 11% of emails used it! In the US, 27%. This year, don’t leave easy wins on the table!
And don’t stop at first names: The most impactful personalizations are contextual — dynamically adjusting body copy or CTAs based on someone’s department, location, or hire date. That’s where personalization can take you far!
Pro tip: Always set fallback values for your tokens (like “there”), so “Hi {first name}” defaults to “Hi there,” not just “Hi ,”.
Text-only emails outperform image emails
This one surprised us! Text-only emails achieve a 19% CTR vs. 15% for emails with images, even though 97% of all emails contain at least one image.
After digging in further, the reason isn’t that images are bad, it’s more about the intent of a plain-text email vs an email with images. When someone opens a plain-text email, they’re typically more focused and more likely to act.
Images and design add richness and personality, which often is the right call… But for emails where your primary goal is a click or action, a clean, simple, text-forward approach can outperform a heavily designed one.
Pro tip: Match your format to your goal. Use designed emails to tell stories and build culture. Use text-heavy emails when you need a specific action.
When is the best time to send?
Best day: Monday
Monday has the highest click rate (12%) and CTR (16%) of any weekday. People come back from the weekend ready to catch up, and an internal email that lands in their inbox Monday morning tends to get attention.
Best time for opens: 9 AM on Monday
If you’re optimizing purely for open rate, Monday at 9 AM is your target. But, we found that emails sent after 5 PM have the highest CTR (17%) — but with an important caveat: this is highly industry-dependent. After-hours sends see a 9% average drop in open rate overall.
For Government, Manufacturing, and Consumer Goods employees, sending after hours hurts performance significantly. But for Professional Services (+24% open rate after hours), Restaurants & Food Services (+12%), and Media & Entertainment (+5%), those late sends can actually outperform.
Pro tip: Use time zone sending whenever possible, and look at your industry benchmarks before defaulting to after-hours sends.
How to write better subject lines
Subject lines in the 21–40 character range achieve the highest open rate at 72%. Slightly longer lines (41–80 characters) are a close second at 70% — so don’t overthink length too much. What matters more is what you say!
Some patterns we see in top-performing subject lines:
- Celebrate people: “Shoutout to [Name]!” or “Meet our newest team members”
- Be transparent: “What’s changing with our team structure” or “CEO transition: What to expect”
- Signal action clearly: “Action required: Submit by [Deadline]” or “Your benefits enrollment ends soon”
- Make it timely: “Happening this week: [Event]” or “Week of March 13 — What you need to know”
- Lead with what employees care about: “Your bonus details inside” or “New perks? You got it!”
Emojis: 8% of all subject lines used one in 2025, and they provide a marginal lift of 0.37 percentage points. Not huge, but they can help your email stand out in a crowded inbox! Use them when they fit your culture.
Pro tip: Use A/B testing to experiment with subject lines! Test one variable at a time so you can clearly see what moved the needle.
What’s the best length for an email?
For most sends, 201–500 words hits the sweet spot for open rates (72%). Keep the majority of your emails in this range and save longer formats (like in-depth newsletters) for content that genuinely warrants it. Better yet, keep your long-form content on a Page or in your intranet!
Format matters too — for most organizations, a visually rich newsletter with employee photos, branded elements, and surveys tends to drive the best engagement. For companies with a lot of frontline or deskless workers, a simple, text-based, mobile-friendly format with a “five things to know” structure works better.
HR and benefits emails drive the highest open and click rates of any content type. Employees actively want this information, and they’re motivated to read it carefully.

SMS benchmarks
SMS is still underused in internal comms, and our data suggests it shouldn’t be! The average click rate for SMS is 29% (nearly 5x higher than email’s 11% average click rate!).
The best SMS day is Friday (30% click rate), and the best time is mid-afternoon around 3 PM. Early morning and lunch hour see notable click rate drops, so avoid those windows!
Keep SMS messages short, put your CTA early in the message, and always confirm opt-in status before sending. The average opt-out rate is just 3%, which signals that when employees consent to SMS, they’re genuinely receptive to it.
Pro tip: SMS is your best tool for time-sensitive or urgent messages — especially for frontline or deskless workers who may not have regular access to corporate email.

Journeys and automation benchmarks
If you’re not using automated email journeys yet, this number should convince you to start: Journeys achieve an 83% open rate and a 96% completion rate, with an average of 3 emails per journey.
Journeys are automated drip campaigns triggered by dates or enrollment events, and they’re most commonly used for:
- New hire onboarding
- Open enrollment
- Work anniversaries and birthdays
- Company events and weekly reminders
IT/security training sequences, return-from-leave journeys, role change announcements, and 90-day/6-month milestone check-ins are more automated email use cases we’ve seen that we love!
New in 2026: Branching lets you fork a journey based on behavior (opened, clicked, ignored), list membership, or attributes like role or location. Combined with A/B testing, this makes automation genuinely powerful for learning what works with different parts of your workforce.

Pages: a sidekick for your internal emails
Pages (branded, mobile-friendly landing pages that live outside the inbox) are perfect for keeping emails short and skimmable while giving employees a place to dig deeper.
The most popular use cases: company events and town halls, new hire onboarding guides, benefits and HR resource hubs, and long-form leadership updates that deserve more space than an email body can offer.
Healthcare leads all industries in Pages usage, with 25,000+ published page views — a strong signal that Pages work especially well for reaching distributed or non-desk workforces.
Pro tip: If you’re creating a Page, put the primary CTA above the fold on both desktop and mobile. And share the link everywhere (not just in the email), like via Slack, SMS, QR code, or digital signage.
AI benchmarks
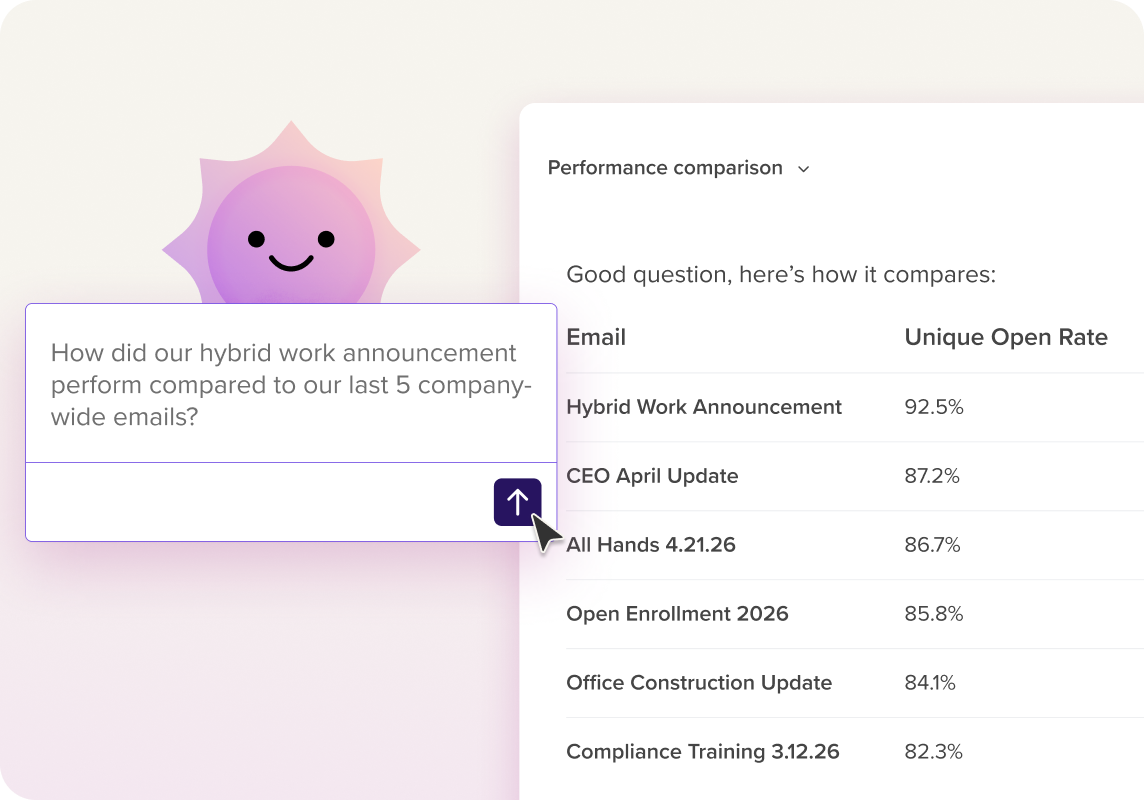
75% of Workshop customers used AI features in 2025, and the most widely adopted features were AI-generated subject lines and preview text. Over 16,000 emails were translated using AI — with Manufacturing leading all industries at 5,500 translations.
AI subject line generation is a great starting point, but treat it as a first draft! Edit for your organization’s voice before sending, and test AI-generated options against your own to see what actually lands with your audience.
Cross-posting
27% of Workshop customers cross-posted an email to another channel in 2025, with SharePoint being the most popular destination. Cross-posting is a one-click process in Workshop’s email editor, and it’s a simple way to extend the reach of your content without doubling your workload! If your employees are split between email, Teams, Slack, and the intranet, cross-posting is the easiest way to meet them where they are.
Benchmarks by industry (at a glance)
One of the most useful parts of the 2026 report is the industry-specific breakdown! Here are some highlights:
Healthcare (74% open rate): Monday at 9 AM is peak. 84% of readers actually read emails (highest read rate in the report). Pages are heavily used and perform well.
Finance (77% open rate): The highest open rate of any industry! Wednesday at 10 AM is peak timing for sends. Finance also leads all industries in AI feature adoption.
Manufacturing (76% open rate): Monday at 9 AM peak. Leads all industries in AI translation usage. After-hours sends hurt performance significantly.
Government (58% open rate): The lowest open rate in the data. After-hours sends cause a 15% drop — government employees strongly prefer business-hours communication.
Technology (68% open rate): Wednesday at 9 AM peak. Despite lower open rates, technology employees read emails thoroughly at a 79% read rate.
Professional Services (72% open rate): After-hours sends actually outperform business hours (+24% open rate), suggesting a workforce that reads beyond 9-to-5.
Media & Entertainment (69% open rate): After-hours also outperforms here! We see the largest lift in open rate (when personalization is used) of any industry.
Restaurants & Food Services (65% open rate): Journeys perform strongly here (72% open rate, 17% click rate). After-hours sends outperform by +12%.
Consumer Goods (64% open rate): Only 7% of emails used personalization in 2025 — making it one of the biggest untapped opportunities for this industry, given personalization lifts open rate from 57% to 78%.
How to build your own benchmarks
Forget about chasing the industry number, your benchmarks should work for you! A few questions to ask as you analyze your data:
- What subject lines have performed best in this campaign?
- Which department is least engaged, and why might that be?
- Are employees reading on mobile or desktop?
- What did the highest-click emails have in common?
- Is there a segment of my workforce that’s consistently under-engaged?
Look at campaign-level trends over time (not just individual sends)… it typically takes 3–5 sends before you can start drawing meaningful conclusions. And don’t forget qualitative feedback! Survey responses, replies, and employee shoutouts are real measures of impact, even if they don’t show up in a dashboard.
Pro tip: Create a “smile file” — a running collection of positive feedback, notable replies, and moments where your comms made a real difference. It’s invaluable for sharing with leadership and for staying motivated on tough days. 🙂
How do your internal comms stack up?
Download our 2026 Internal Communication Benchmarks & Best Practices Report to find out!
Download the report
Internal communications is one of the most impactful jobs in any organization — and meaningful data makes it better. Whether you’re trying to build the business case for a new tool, optimize a specific campaign, or just get a sense of how you’re doing, these benchmarks are here to give you a head start. 💙
Data sourced from 186 million emails sent across 580 companies and 13 industries via Workshop between January 1–December 31, 2025.