

 Teams
 SharePoint
 Slack
 QR Codes
 PDF
 Active Directory
 Workday
 ADP
 Canva
AI | Email | Internal Communication | Metrics | Productivity | Tools
Internal communication analytics: a glossary for proving ROI


You know your messages matter, but the hard part is showing it in numbers your C-suite will nod along to. This glossary takes you through every internal communications analytics term in an easy-to-understand way, with how to calculate it, where to find the data and how it helps prove the value of your work.
Bookmark it, share it with your team, and pull it up the next time someone asks, “So what did that email actually do?”
What are internal communication analytics?
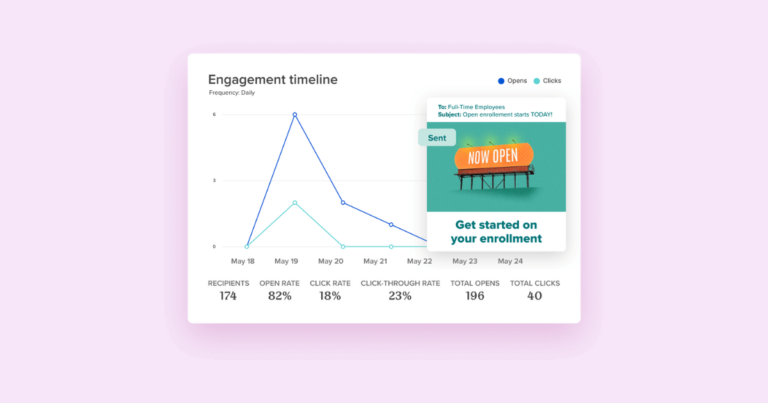
Internal communication analytics are the data behind your messages: who received them, who read them and what they did afterward. Opens and clicks are where it starts. The real value is connecting those numbers to things leadership cares about, like faster policy adoption or more people enrolling in benefits on time.
Think of it as a ladder with three rungs — each section of this glossary covers one:
- Reach and attention: did the message get to people, and did they read it?
- Action and sentiment: did they do something, and how do they feel?
- Business impact and ROI: what changed for the company, and what was it worth?
Most teams report on the first rung, but ROI lives on the third! The terms below help you climb the ladder. 🙂
Not sure which numbers to track in the first place? Start with our guide to which internal communication metrics to track, then come back here for the how-to.
Rung 1: Reach and attention terms
These terms answer the first question leaders ask: did people actually see it? On their own they don’t prove ROI, but every ROI story starts here.
Baseline
Your starting point for any number you’re measuring! Usually the baseline is the average of your last three months. After you calculate your baseline, every improvement you report is measured against that number.
- Calculate it: sum of a number across your last 3 months of sends ÷ number of sends
- Find it: export past send reports from your email platform or intranet
- Use it to prove value: “Click-through rate rose from a 4% baseline to 7% after we moved to shorter emails” is a story, “7%” alone isn’t.
Segment
A group of employees you analyze separately, like a department, location, role or manager’s team. Segments turn a company-wide average into a map of where to act.
- Find it: platforms synced with your HRIS keep segments current automatically
- Use it to prove value: show that a targeted fix (like a manager toolkit for one site) closed a gap for that segment
Delivery rate
The share of messages that reached an inbox without bouncing. A low delivery rate usually means an outdated distribution list.
- Calculate it: emails delivered ÷ emails sent × 100
- Find it: your email platform’s send report
- Use it to prove value: cleaning lists shows leaders you’re reaching everyone, including employees who were silently missed
Reach
The number of unique employees who received a message across every channel you used, counted once each.
- Calculate it: unique employees who received the message on at least one channel ÷ total employees in the audience × 100
- Find it: combine recipient lists from email, intranet, SMS and chat, then remove duplicates
- Use it to prove value: essential for compliance and safety messages, where “98% of frontline staff received the update” is the whole point
Unique opens vs. total opens
Unique opens count each person once, total opens count every time anyone opened the message. Use unique opens for rates and total opens to spot messages people came back to.
- Find it: most email platforms report both side by side
Open rate
The share of recipients who opened a message.
- Calculate it: unique opens ÷ emails delivered × 100
- Find it: your internal email platform (Outlook distribution lists can’t report this per person)
- Use it to prove value: trend it over time against your baseline. For context, the median internal email open rate across Workshop customers is 73%, and the top quartile reaches 83% (2026 Internal Communication Benchmarks report)
Machine opens (Apple Mail Privacy Protection)
Opens recorded automatically when Apple Mail preloads a message, whether or not a person looked at it. They can inflate open rate, especially on personal iPhones.
- Find it: some platforms flag or filter machine opens; check your platform’s settings
- Use it to prove value: lean on click-through rate and read time when you report to leadership, since they aren’t affected
Read time
How long people spent with a message after opening it. Workshop groups every open into one of three buckets: read (more than 8 seconds), skimmed (3–8 seconds) or glanced (under 3 seconds).
- Calculate it: opens in each bucket ÷ unique opens × 100
- Find it: internal email platforms that track time in message. Benchmark: across Workshop customers, 77% of opens are read, 8% skimmed and 15% glanced.
Expected read time
How long a message should take to read at an average pace (about 200–250 words per minute). Comparing it with actual read time shows whether people read or skimmed. Try our read time calculator.
- Calculate it: word count ÷ 238 = minutes
- Use it to prove value: “Employees spent 90% of the expected read time on the benefits email” shows real attention, not just opens
Rung 2: Action and sentiment terms
This is where analytics gets persuasive. These terms show that employees did something because of your message, and how they feel about the communication they get.
Click rate vs. click-to-open rate
Two ways to measure clicks, and teams mix them up all the time. Click rate compares clicks with everyone who received the email. Click-to-open rate (often called click-through rate in internal comms) compares clicks with only the people who opened it, so it measures how compelling the content was.
- Calculate click rate: unique clicks ÷ emails delivered × 100
- Calculate click-to-open rate: unique clicks ÷ unique opens × 100
- Find it: your email platform’s link report.
- Benchmark: Workshop customers average an 11% click rate and a 15% click-to-open rate.
- Use it to prove value: click-to-open rate isn’t inflated by machine opens, which makes it a safer number to show leadership
Acknowledgment rate
The share of employees who confirmed they read a required message, like a policy update or safety notice.
- Calculate it: employees who acknowledged ÷ employees who received it × 100
- Find it: read-receipt or acknowledgment features in your email platform, intranet, or LMS
- Use it to prove value: a clear compliance win; pair it with “time to 90% acknowledgment” to show speed
Goal completion rate
The share of targeted employees who completed the action your message asked for: enroll in benefits, finish training, register for an event.
- Calculate it: employees who completed the action ÷ employees targeted × 100
- Find it: the system where the action happens (benefits portal, LMS, registration form), filtered to your audience
- Use it to prove value: this is your strongest bridge to ROI, because completed actions usually have a cost or value attached
UTM parameters
Short tags added to the end of a link (like ?utm_source=newsletter) that tell your analytics tool which channel sent the visitor.
- Find it: build links with any UTM builder, then view results in Google Analytics or your intranet analytics by source
- Use it to prove value: shows which channel drives the most action, so you can put time where it pays off
Attribution
Connecting an outcome back to the communication that caused it. Perfect attribution is rare internally, so aim for reasonable evidence: timing, UTM-tracked clicks, and a comparison group.
- Use it to prove value: “Enrollment jumped 22 points in the 48 hours after the reminder” is attribution by timing. It’s honest, simple, and convincing.
Participation rate
The share of employees who took part in a voluntary program, like sharing company posts (employee advocacy), joining a town hall, or answering a pulse survey.
- Calculate it: employees who participated ÷ employees invited × 100
- Find it: your advocacy tool, event platform, or survey tool
Survey response rate
The share of employees who answered a survey. A low response rate makes every other survey number less reliable.
- Calculate it: completed responses ÷ employees surveyed × 100
- Find it: your survey tool
Favorability score
The share of survey respondents who chose a positive answer (like “agree” or “strongly agree”) on a question such as, “I feel informed about company decisions.”
- Calculate it: favorable responses ÷ total responses to that question × 100
- Find it: your internal communications or engagement survey. Workshops survey template includes ready-made questions.
- Use it to prove value: track “I feel informed” year over year; it’s the closest thing internal comms has to a customer satisfaction score
Employee net promoter score (eNPS)
How likely employees are to recommend the company as a place to work, on a 0–10 scale. Promoters answer 9–10 and detractors answer 0–6.
- Calculate it: % promoters − % detractors (a score from −100 to 100)
- Find it: your engagement survey platform or HR team
Rung 3: Business impact and ROI terms
These are the terms that get internal comms a seat at the planning table. They translate your analytics into time, money, and risk – the language leadership already speaks.
Leading vs. lagging indicators
- Leading indicators move first and predict results (clicks, acknowledgments, completions).
- Lagging indicators show results after the fact (retention, engagement scores, revenue).
- Report both: leading indicators show momentum now, lagging indicators confirm the payoff later.
Comparison group
A similar group of employees who didn’t get a message, or got a different version. Comparing the two is the most credible way to show your communication caused a change.
- Find it: split a send by location or team, or compare with the same campaign last year
- Use it to prove value: “Sites that got the manager toolkit hit 91% completion vs. 74% for sites that didn’t” is hard to argue with
Time to inform
How long it takes for a target share of employees (often 80% or 90%) to receive and open a critical message.
- Calculate it: time of send → time the target share has opened or acknowledged
- Find it: timestamped open or acknowledgment data from your platform
- Use it to prove value: vital for crisis and safety communication, where faster really does mean less risk
Cost per employee reached
What it costs to get a message to one employee, including tools and staff time.
- Calculate it: (tool costs + staff hours × hourly cost) ÷ employees reached
- Find it: your software invoices and a quick estimate of hours per send
- Use it to prove value: shows efficiency gains when you consolidate channels or automate sends
Hours saved
Employee time recovered when communication gets clearer or more consolidated, like replacing six scattered emails with one weekly roundup.
- Calculate it: employees affected × minutes saved per week × working weeks ÷ 60
- Find it: estimate minutes saved with a quick pulse survey or by timing the old and new process
- Use it to prove value: multiply by average hourly cost to put a dollar figure on it
Cost avoided
Money the company didn’t spend because communication prevented a problem: fewer HR tickets, fewer late benefits enrollments, fewer safety incidents, fewer regretted resignations.
- Calculate it: (problems before − problems after) × cost per problem
- Find it: HR ticket volume, safety logs or turnover reports, plus your finance team’s cost per problem
Internal communications ROI
The return the company gets for every dollar it invests in internal communications.
- Calculate it: (value created − cost of the program) ÷ cost of the program × 100
- Find it: “value created” is the sum of hours saved, cost avoided and goal completions with a known value; “cost” is tools plus staff time
Worked example (illustrative numbers): a 1,000-person company replaces scattered announcements with one weekly roundup.
| Step | Calculation | Result |
|---|---|---|
| Hours saved | 1,000 employees × 5 min/week × 48 weeks ÷ 60 | 4,000 hours |
| Value created | 4,000 hours × $45 average hourly cost | $180,000 |
| Cost of the program | Software + 4 staff hours/week | $30,000 |
| ROI | ($180,000 − $30,000) ÷ $30,000 × 100 | 500% |
Use conservative estimates and show your math. A smaller number leaders trust beats a big number they question.
How to turn your analytics into an ROI story
Numbers win budget when they tell a story. Use this five-step format for your next quarterly report:
- Name the business goal. “Get 95% of employees through open enrollment on time.”
- Show the baseline. “Last year, 81% enrolled by the deadline.”
- Show what you did. “We added a manager toolkit and two SMS reminders for frontline teams.”
- Show the climb. Reach → click-to-open rate → goal completion rate, one number per rung.
- Put a value on it. “That’s 140 fewer late enrollments, saving HR roughly 280 hours of follow-up.”
- Calculate the cost-per-employee. Communicating with your employees effectively is absolutely worth $8/employee/year, for example. 😉
Keep the whole story to one slide. If leaders want more, the rest of the data is ready.
FAQ
How do you prove the ROI of internal communications?
Tie a communication to a business goal, compare results against a baseline or comparison group, then convert the change into hours saved, costs avoided or goals completed. Divide the value by the program’s cost.
How do you measure internal email performance?
Start with delivery rate, open rate, click-to-open rate and read time from your internal email platform. Then segment by team or location to see where messages land and where they don’t.
What tools do you need to measure internal communication analytics?
An internal email platform with per-person analytics, your intranet or web analytics, your survey tool and access to HRIS data for segments. A spreadsheet can tie them together until you’re ready for a dashboard.
How often should you report on internal communication analytics?
Share leading indicators monthly and ROI stories quarterly. That rhythm keeps leadership informed without burying them in numbers.
Get your analytics without the spreadsheet wrangling. Workshop tracks opens, clicks, read time and engagement by segment for every send, so your ROI story is ready when leadership asks. See Workshop’s analytics in action!